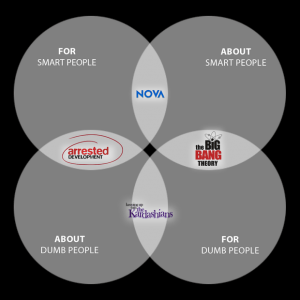
If you can’t communicate the underlying relationships to your audience, it doesn’t matter how much you know about your data. Here are some well communicated, if not terribly important, depictions of common and separate sets.

If you can’t communicate the underlying relationships to your audience, it doesn’t matter how much you know about your data. Here are some well communicated, if not terribly important, depictions of common and separate sets.