• Log In
Skip to primary content

Applied Data Analysis

Sociology 3318.003 — fall 2020 — TR 3:30 — UAC 424

Applied Data Analysis

Main menu

  • Home
  • Calendar
  • Details
  • Bob Price at Texas State

Post navigation

← Previous Next →

Regression Visualization Widgets

Posted on November 8, 2020 by Bob Price

visualization of least squares

These are very handy for wrapping your head around what we’re doing when we find the regression line/least square line/line of best fit.

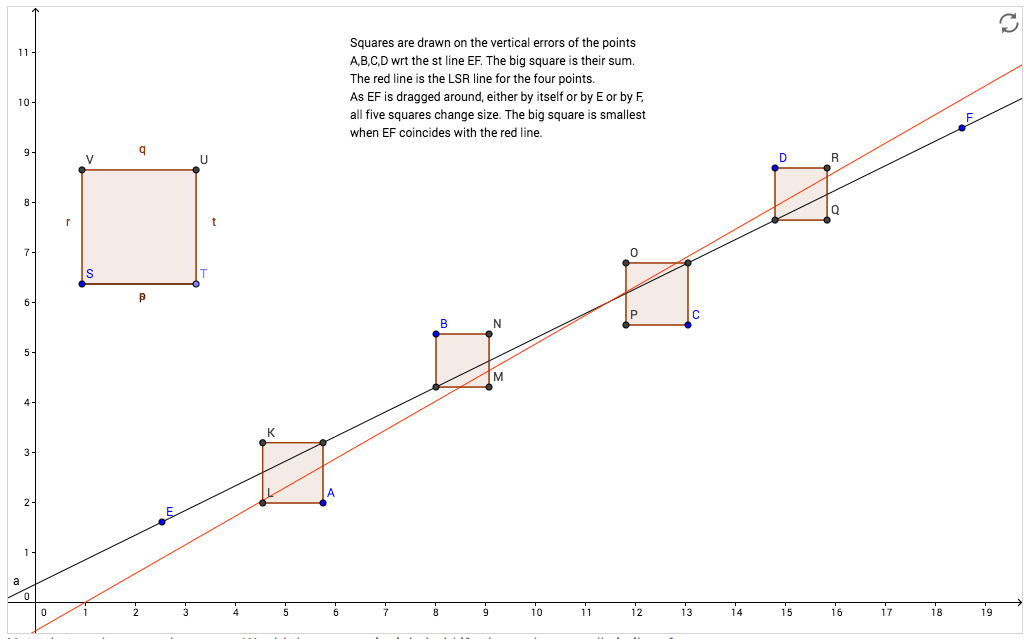
Here’s an applet for seeing what the line of best fit is doing.

And here’s an interactive explanation of least squares.

This entry was posted in Uncategorized by Bob Price. Bookmark the permalink.
Proudly powered by WordPress